In Part 1, we identified the “Spaghetti Code” problem: the tendency for retail trading scripts to mix entry signals, visual plotting, and risk logic into a tangled mess that is impossible to trust with real money.
Today, in Part 2, we explore the solution: The QuantView “Framework First” Architecture.
If you are a technical investor, you know that a trading system is only as strong as its weakest link. At QuantView Dynamics, we believe that the entry signal (when to buy) is rarely the weak link. The weak link is almost always Execution and Risk Management.
To solve this, we built the QuantView Base Framework using a modular architecture that strictly separates the Strategy from the Execution. We call this the “Brain vs. Muscle” approach.
The Brain: The Strategy Layer
In our free demo, the QV with MA Crossover, the “Brain” is intentionally simple. It represents the signal.
If you look at the code, the “Brain” occupies a tiny fraction of the script. Its job is to answer one question: Does the technical indicator suggest a move?
In this specific case:
1. Calculate: It computes a Fast Moving Average (e.g., 9-period) and a Slow Moving Average (e.g., 21-period).
2. Compare: It checks if the Fast line has crossed over the Slow line.
3. Request: If a cross occurs, it raises a flag: “I would like to buy.”
In a standard TradingView script, this request would immediately trigger a market order. But in the QuantView ecosystem, the “Brain” has no authority to execute trades. It can only submit a request to the “Muscle.”
The Muscle: The QuantView Framework
Once the Strategy submits a request, the Framework takes over. Think of the Framework as an institutional risk manager sitting next to you. It takes the “Buy” signal and runs it through a rigorous gauntlet of checks before allowing a single dollar to be risked.
Here are the three critical filters the Framework applies to every signal:
1. Context Filtering: The “When”
A good signal at the wrong time is a bad trade. The Framework checks the Global Context:
• Time Windows: Are we currently in a valid trading session as defined by the user? (e.g., avoiding the low-volume Asian session for EURUSD).
• Backtest Range: Are we inside the specific date range defined for testing, as set by the user?
• Data Integrity: Are we running on “Real-Time” data or “Emulated” data? (We will cover the magic of Time Emulation in Part 3).
2. Trend Filtering: The Long Term Trend (LTT)
One of the most powerful features built into the QuantView Framework is the Long Term Trend (LTT) filter.
Most novice bots fail because they try to buy dips in a crashing market. The Framework calculates a higher-timeframe trend (e.g., 4-hour trend direction) independently of your strategy.
• If the LTT is Bearish, the Framework will automatically reject “Buy” signals from the MA Crossover “Brain.”
• If the LTT is Bullish, it will reject “Short” signals.
This forces your strategy to trade with the current current, increasing your probability of success automatically.
3. Dynamic Position Sizing: The “How Much”
This is where QuantView separates itself from 99% of retail scripts. Most scripts use fixed lot sizes (e.g., “Buy 1.0 Lot”), which leads to inconsistent risk.
The QuantView Framework calculates risk dynamically in four precise steps:
1. Analyze Volatility (ATR): First, the system analyzes recent market volatility using the Average True Range (ATR). It calculates a dynamic Stop Loss distance (e.g., 3x ATR) tailored to the current market behavior.
2. Shape the Order (RR): Second, it applies your defined Reward:Risk Ratio (e.g., 2:1). If the volatility check sets your Stop Loss 10 pips away, the Framework automatically places your Take Profit 20 pips away to ensure the mathematics of the trade are as you requested.
3. Assess Account Risk: Third, it looks at your current Account Balance and your defined Risk Percentage (e.g., 2.0%) to determine exactly how much capital you are willing to lose if the trade fails.
4. Solve for Lot Size: Finally, it mathematically solves for the exact position size (lots). Whether your Stop Loss is 5 pips or 50 pips, the system adjusts the lot size so your financial risk remains exactly 2.0%.
The Power of Modularity
Why does this “Brain vs. Muscle” separation matter to you as an investor?
Reliability. You can swap out the “Brain” whenever you want. You can replace the MA Crossover with an RSI strategy, a Bollinger Band breakout, or a complex Smart Money Concept (SMC) logic. We will be creating all of these variations and more, so you will have many choices of which indicator to use.
However, the Muscle—the code that handles your money, calculates your risk, checks the trend, and talks to the broker—remains exactly the same. You don’t have to rebuild your risk management system every time you want to test a new indicator. You get institutional-grade reliability on every strategy you deploy.
Transparency is Key
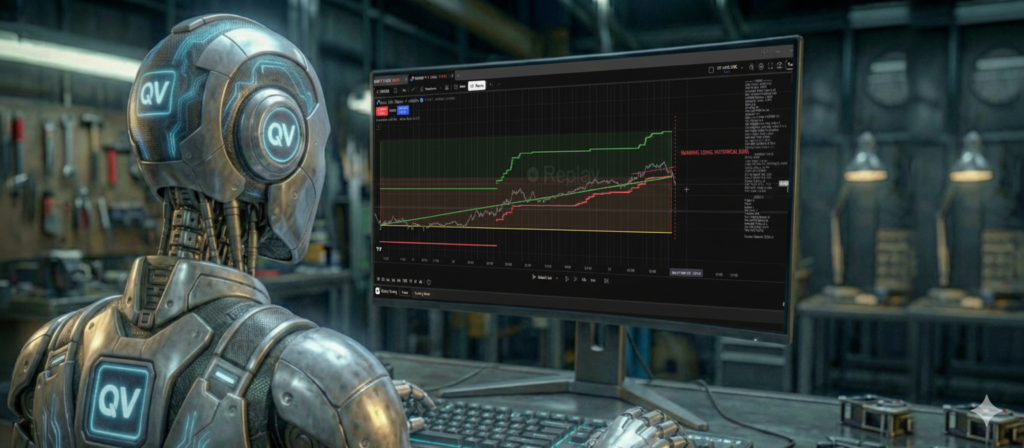
We believe in “Glass Box” trading. You should see exactly why a trade was taken or rejected.
• Green Lines: Show exactly where the trade entered and exited.
• Info Panel: Displays your current Risk %, Drawdown, Profit Factor, Net Profit and more in real-time.
• Debug Logs: (Optional) Show you the internal decision-making process of the Framework tick-by-tick.
Experience the Difference
Reading about a robust framework is one thing; seeing it filter bad trades in real-time is another.
We invite you to download the QV with MA Crossover demo. It is a fully functional version of our Framework (Brain included) that allows you to test these concepts—Dynamic Risk, LTT Filtering, and Time Emulation—completely free.
Pre-Register for the Free QV with MA Crossover Demo Here
In Part 3, we will tackle the most controversial topic in automated trading: Time. We will explain how QuantView’s “Time Emulation” allows you to trade any timeframe from a 1-minute chart to get better entries and zero repainting.