Welcome to the final installment of our “Mastering the Market” series.
Throughout this series, we have dismantled the “Spaghetti Code” typical of retail trading tools and replaced it with a robust Trading Operating System. We have covered:
1. The Framework: Separating the “Brain” (Strategy) from the “Muscle” (Execution).
2. Risk: Dynamic position sizing that protects your account automatically.
3. Time: The “Rolling Window” engine that eliminates repainting.
4. Management: Break-even triggers and sliding stops.
5. Execution: Bridging the gap between the chart and the broker.
Now, we face the final hurdle: Trust.
How do you know if a strategy actually works? In the world of algorithmic trading, most systems are “Black Boxes.” You feed them money, and they spit out buy/sell signals based on hidden logic. If they lose money, you don’t know if it was a bad market, a bad strategy, or a bug.
At QuantView Dynamics, we believe in “Glass Box” Trading. You should see exactly what the system is doing, why it is doing it, and exactly how it is performing in real-time.
In this final post, we explore the Info Panel and Visual Debugging tools built into the QV with MA Crossover.
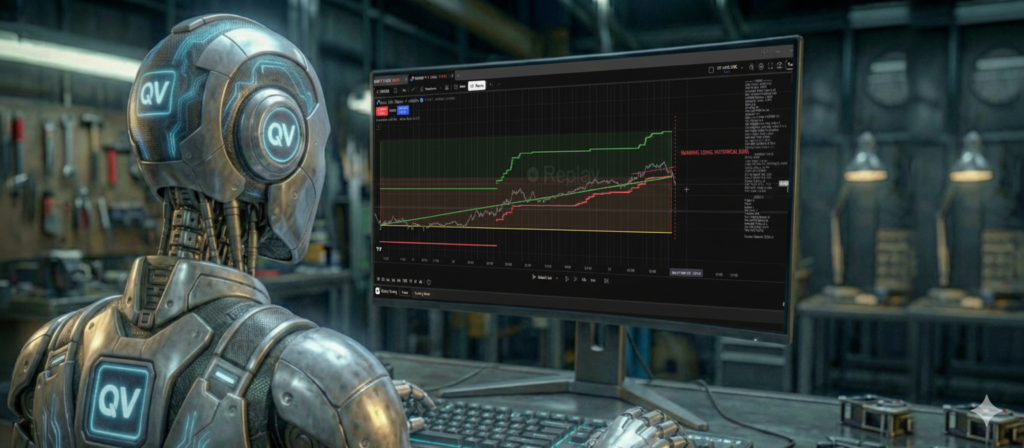
The Dashboard: Real-Time Truth in Data
If you load a standard indicator on TradingView, you often have to open a separate “Strategy Tester” tab to see results. These results are often static and based on historical assumptions that don’t match live trading.
The QuantView Framework includes a proprietary, on-chart Info Panel. This isn’t just a text box; it is a live HUD (Heads-Up Display) that updates on every single tick.
When you run the QV with MA Crossover demo, this panel provides a transparent audit of your strategy’s health. Here are the critical metrics we track, and why they matter more than simple “Net Profit.”
1. Realized RR (Reward-to-Risk Ratio)
Novice investors obsess over Win Rate. They want a bot that wins 90% of the time. Professional investors know that a 90% win rate is meaningless if your losses are ten times larger than your wins.
The Info Panel tracks your Realized RR.
• The Theory: You set a 2:1 target.
• The Reality: Broker spread, slippage, and early exits (sliding stops) change the math.
• The Insight: If the panel shows a Realized RR of 1.8, you know your strategy is healthy. If it drops to 0.5, you know you are cutting winners too early, regardless of what the backtest says.
2. Max Drawdown % (The “Sleep” Metric)
Total Profit tells you how much you made. Max Drawdown tells you how much pain you endured to get it. The Framework calculates the deepest percentage drop from your account’s peak.
• If a strategy makes 100% profit but has a 50% drawdown, it is uninvestable for most people.
• The QuantView Framework is designed to minimize this number through the Dynamic Risk Management we discussed in Part 2.
3. The “State” Monitor
The panel also displays the internal state of the algorithm:
• Stop Status: Is the current trade using a “Wide” stop, a “Tight” stop, or has it moved to “Break Even”?
• Signal Status: Are the Moving Averages currently signaling a Buy, or is the Long Term Trend (LTT) filter blocking the trade?
Visual Debugging: An Audit Trail on Your Chart
Numbers are great, but humans are visual creatures. We need to see the trade logic to trust it. Standard scripts simply place “Buy” and “Sell” labels. QuantView draws the entire story.
1. Trade Lines: The Visual Ledger
When a trade closes in the QV with MA Crossover, the Framework draws a thick line connecting the Entry Point to the Exit Point.
• Green Line: The trade was profitable.
• Red Line: The trade was a loss.
This allows you to visually audit the history. You can scroll back through the chart and instantly see: “Did this strategy catch the big trend?” or “Did it get chopped up in the consolidation?” You don’t have to guess where the entry and exit occurred; the line connects them physically on the screen.
2. The Trust Line (Data Integrity)
One of the most unique features of QuantView is the Trust Line. When you change settings or reload the script, the Framework has to rebuild its internal history (g_history) to calculate the Emulated Timeframes.
• The system draws a vertical red dotted line at the point where calculation began.
• Why? Data before the Trust Line is static history. Data after the Trust Line is calculated using our robust emulation engine. This ensures you never confuse a theoretical backtest with live, emulated performance.
Conclusion: The QuantView Standard
We started this series with a simple Moving Average Crossover—perhaps the oldest strategy in trading.
By itself, a Moving Average Crossover is not a profitable strategy. But when you wrap it in the QuantView Framework, it becomes something else entirely.
• It gains Time Emulation to trade 1-hour trends with 1-minute precision.
• It gains Dynamic Risk to protect your capital.
• It gains Order Management to handle broker spreads.
• It gains Feedback to let you know exactly how it performs.
This is the power of a Trading Operating System. It turns simple ideas into professional strategies.
Your Journey Starts Here
We didn’t just write this series for you to read; we wrote it for you to do.
The QV with MA Crossover is available right now as a free demo. It contains the full power of the Framework we have discussed over these six articles.
Download it. Turn on the “Per Candle” trailing stop. Adjust the “Broker Spread.” Watch the Info Panel update in real-time. Experience the difference between a simple script and a professional trading framework.
PreRegister for the Free QV with MA Crossover Demo Here
Thank you for reading Mastering the Market. We look forward to seeing how you trade with QuantView.