Dynamic Volatility Bands Meet Momentum Filtering
Traditional breakout trading often forces traders into a frustrating dilemma: jump into a fast-moving trend and get whipped out by sudden exhaustion, or wait for an extended confirmation only to buy the exact top. Standard price-based Donchian channels excel at marking multi-period extremes, yet they frequently lag rapid shifts in underlying velocity. Meanwhile, standalone oscillators like the Relative Strength Index (RSI) reliably flag momentum boundaries but offer little structure for timing sustained directional expansion.
The RSI Donchian Breakout indicator by QuantView Dynamics bridges this gap directly on your main price chart. By projecting an envelope of adaptive Donchian volatility channels onto a smoothed RSI curve—and anchoring the synthesis straight against price action—the tool filters out false momentum thrusts and isolates high-probability breakout expansions. Built with strict non-repainting execution, integrated structural risk controls, and continuous telemetry diagnostics, this indicator equips technical traders with a systematic framework to exploit structural momentum without sacrificing capital discipline.
Moving Beyond Lag: The Mechanics of Channelized Momentum
Most momentum indicators fail during choppy market regimes because raw price spikes distort volatility calculations. Standard Donchian channels track the highest high and lowest low of price over a fixed window, meaning a single news-driven spike can artificially widen your bands for hours or days.
The RSI Donchian Breakout solves this issue through a three-stage mathematical pipeline:
- Noise-Filtered Velocity Calculation: Instead of computing channels over raw price swings or erratic oscillator spikes, the tool calculates a base Relative Strength Index and passes it through an advanced moving average filter (such as Hull MA, VWMA, EMA, WMA, or standard SMA). This curve smoothing strips away micro-choppiness while preserving responsive momentum inflection points.
- Dynamic Momentum Extremes: The system computes rolling upper, lower, and median Donchian boundaries directly from the smoothed momentum stream. A true breakout occurs only when smoothed momentum pierces the prior completed channel boundary, confirming that internal market pressure has reached a statistical extreme relative to its recent cycle.
- Midline Gating and Boundary Protection: To prevent the indicator from buying into late-stage exhaustion, the system deploys two distinct protective gates:
- Boundary Threshold Limits: Long entries are blocked if momentum has already pushed into extreme overbought territory, and short entries are blocked if momentum is buried in oversold depth.
- The Midline Reset Filter: Once a breakout establishes a swing extreme, the indicator requires momentum to re-cross its dynamic Donchian median baseline before registering a subsequent valid setup. This structural reset eliminates the repetitive false triggers common in choppy consolidation ranges.
AI-Powered Self-Tuning and Adaptive Optimization
A major technical challenge in algorithmic trading is parameter decay: a lookback window or stop-loss distance that excels during a trending week can struggle when markets transition into range-bound consolidation. The RSI Donchian Breakout overcomes this limitation with an integrated, intelligent parameter optimization engine.
Real-Time Hill-Climbing Adaptation
Rather than forcing traders to guess the best settings, the indicator incorporates a forward-simulating self-tuning engine that learns from active trade outcomes:
- Reinforcement Feedback: When a simulated trade successfully hits its profit target, the system applies positive reinforcement, continuing to nudge channel lookbacks, reward-to-risk ratios, and volatility multipliers along their profitable gradient.
- Negative Feedback and Correction: If a simulated setup gets stopped out, the optimization engine flips its search trajectory, tightening risk tolerances, adjusting lookback sensitivity, and widening defensive cool-off buffers.
- Dynamic Bounded Guardrails: All automated parameter adjustments stay safely locked within user-defined upper and lower boundaries, preventing runaway curve-fitting while letting the tool adapt smoothly to shifting volatility regimes.
Technical Strengths and Analytical Edge
- Drastic Noise Filtration: By applying Hull and Volume-Weighted moving average smoothing directly across the momentum series, false tick fluctuations are neutralized before channel extremes are evaluated.
- Price-Anchored Spatial Perspective: Unlike standard secondary oscillators that isolate momentum in a detached sub-window, the indicator visually projects its channel fill and momentum line onto price action using volatility-adjusted scaling.
- Adaptive Risk and Outlier Protection: Integrated stop-loss protocols allow traders to toggle between dynamic Average True Range (ATR) distances and swing structure levels, complete with an outlier volatility cap to prevent erratic candle spreads from bloating trade risk.
- Systematic Post-Loss Cool-Off: Following a stopped-out trade, the engine automatically enforces an operational cool-off period across a user-defined number of bars, stopping emotional revenge trading and whipsaw cycles during sudden volatility regime shifts.
- Dynamic Trade Lifecycle Management: Positions do not rely solely on rigid price targets; the system actively monitors trend decay and flags defensive exits if momentum crosses back through the Donchian midline or exceeds an operational time horizon.
Tactical Implementation Across Trading Horizons
Different operational styles require distinct calibration of channel sensitivity and risk multiples. The RSI Donchian Breakout adapts effectively across various intraday and swing setups:
| Trading Style | Typical Timeframes | Recommended Setup & Focus | Operational Focus |
| High-Frequency Scalping | 1-Minute to 5-Minute | Use responsive Hull MA smoothing (lengths 5–8) with tight channel lookbacks (15–20 bars). ATR-based stops capped at 2.0x volatility. | Captures rapid momentum bursts off liquidity pools. Enforces immediate exit on midline flips to cut off stalls instantly. |
| Day Trading | 15-Minute to 1-Hour | Standard 14-period RSI combined with 28-period Donchian lookback. Midline reset requirement strictly active. | Isolates morning session expansions and trend continuation out of consolidation ranges while avoiding midday chop. |
| Swing Trading | 4-Hour to Daily | Extended Donchian lookback (35–50 bars) paired with Structure-based stop-loss placement buffered by baseline ATR. | Rides sustained macro trends across major currency pairs, allowing wide structural swings while monitoring midline decay for systematic trailing. |
Visual Architecture and Chart Interface
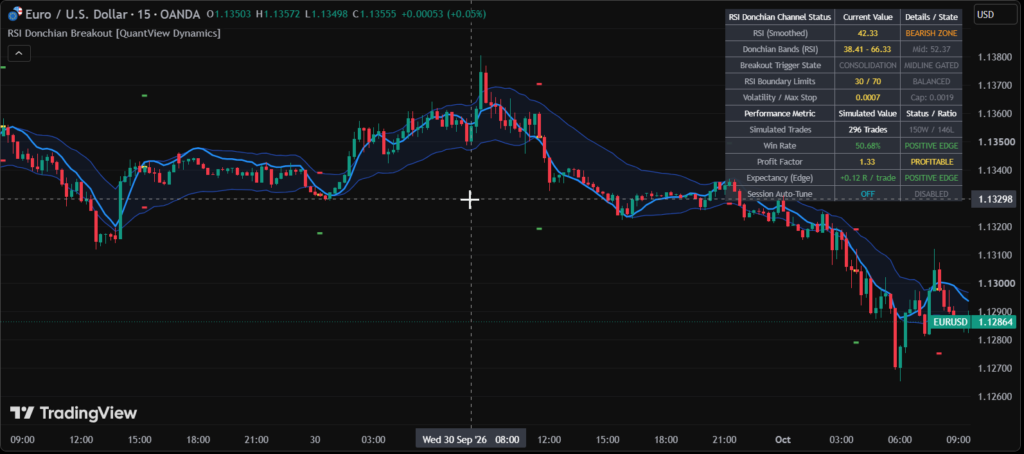
When applied to your workspace, the RSI Donchian Breakout provides a clear, layered visualization designed to maximize situational awareness without cluttering your price action:
- The Volatility Cloud: An ATR-scaled Donchian envelope plots smoothly alongside price, shaded with a subtle blue fill to mark the active momentum corridor. A vibrant center curve tracks real-time smoothed momentum relative to its outer extremes.
- Signal Dash Markers: Precise horizontal markers appear instantly on confirmed breakout bars:
- Yellow Dash: Exact trade entry reference.
- Green Dash: Pre-calculated take-profit price objective based on the active reward-to-risk ratio.
- Red Dash: Volatility-capped stop-loss level.
- Active Bias Candle Tinting: An optional visual toggle tints candles green during active long momentum states and red during short states, giving an instant read on underlying market posture.
- Performance HUD Dashboard: An on-screen analytics table pinned to your preferred chart corner tracks real-time operational telemetry:
- Channel Status: Current smoothed RSI value, baseline midline levels, and active trigger state (higher highs vs. lower lows).
- Volatility Diagnostics: Current ATR readings paired with active outlier risk caps.
- Forward Simulation Telemetry: Live historical trade counts, win rate percentages, profit factor ratings, and net expectancy in R-multiples.
Parameter Configuration Guide
The indicator features clean functional groups to customize every layer of the execution engine:
RSI Donchian Core Strategy
- RSI Period Length: Sets the calculation period for the underlying Relative Strength Index (Default: 14).
- RSI Oversold Level: Defines the short trigger floor; prevents entering short trades when momentum is already deeply depleted (Default: 30.0).
- RSI Overbought Level: Sets the long trigger ceiling; prevents buying into overextended tops (Default: 70.0).
- Donchian Channel Lookback: Specifies the number of bars used to determine the highest and lowest momentum bands (Default: 28).
- Require Midline Re-Cross for Reset: Gating filter that requires the momentum curve to cross back over the channel median before approving a new breakout setup.
RSI Moving Average Smoothing
- Apply MA Smoothing to RSI: Enables or disables the noise-reduction filter prior to channel processing.
- RSI MA Smoothing Type: Selectable smoothing algorithms, including Hull MA, VWMA, EMA, WMA, and SMA.
- RSI MA Smoothing Length: Lookback period for the smoothing filter (Default: 8).
Risk Management & Simulation Targets
- Allow Concurrent Trades: Determines whether secondary breakouts can trigger while an existing position state remains open.
- Exit Active Trade on Midline Flip: Automatically closes simulated active trades if momentum reverses through the channel median.
- Stop Loss Calculation Mode: Toggles initial protective stop logic between dynamic volatility (ATR) and recent price swing structure (Structure).
- Stop Loss ATR Multiplier: Multiplier applied to current volatility to define stop distance in ATR mode (Default: 1.75).
- Max Initial Stop (ATR Multiplier Cap): Outlier ceiling applied against baseline volatility to prevent wide news candles from establishing disproportionate risk envelopes.
- Reward-to-Risk Ratio (R:R): Defines the mathematical take-profit objective as a multiple of initial capital risked (Default: 1.75).
- Post-Loss Cool-Off (Bars): Number of bars trade entry logic remains paused following a stopped-out loss.
- Enable Trade Timeout / Timeout Bars: Time-decay filter that closes stagnant trades after a specified bar duration.
Visual & HUD Settings
- Show Price-Anchored RSI Donchian Bands: Controls rendering of the projected momentum cloud and channel lines directly on price.
- Show Signal Markers: Toggles visibility of the yellow entry, green profit, and red stop dashes on signal bars.
- Color Candles on Active Bias: Toggles dynamic directional candle coloring based on open momentum bias.
- Show Performance HUD / HUD Position / HUD Text Size: Adjusts the on-chart visibility, corner placement, and font size of the real-time performance dashboard.
Systematic Evaluation
The RSI Donchian Breakout provides a significant technical upgrade over standard directional momentum indicators. By wrapping a moving-average-filtered RSI inside dynamic Donchian boundaries, it addresses the two most common pitfalls of momentum trading: jumping into overextended trends and taking false signals during choppy consolidations.
The built-in protective mechanisms—such as the midline reset requirement, structural outlier caps, and automated post-loss pauses—provide active traders with built-in risk governance right out of the box.
Algorithmic Automation and QuantView Bridge Readiness
For quantitative traders building rule-based systems, this indicator is built for automated integration:
- Non-Repainting Execution: All signal markers, state changes, and stop/target levels calculate strictly on confirmed bar closes, ensuring historical visual behavior matches forward automated execution.
- Continuous Telemetry Bridge: The indicator includes continuous background data plots—such as active stop levels, profit targets, directional state, and raw entry pulses—that can be mapped directly into external order-routing webhooks or systematic trading bridges.
- Deterministic Risk Envelopes: Because entry price, stop-loss distance, and target objectives are resolved and bounded on the trigger bar, position-sizing algorithms can calculate fixed-fractional lot allocations immediately upon alert dispatch.
- Systematic State Machine: The indicator’s internal state tracking handles position lifecycles, directional flips, and time decay without requiring external state management on the execution side.
How are you integrating dynamic channel breakouts into your daily trading workflow? Share your favorite asset classes, optimal timeframe combinations, and settings in the comments below. If there is a technical indicator or algorithmic concept you would like our quantitative research team to review next, let us know!
All content, products, and opinions provided are for educational and entertainment purposes only and do not constitute professional financial, investment, or legal advice. We are not licensed financial advisors, and nothing herein is a recommendation to buy or sell any financial instruments. You assume full responsibility for your own financial decisions and due diligence, and we accept no liability for any losses or damages resulting from your use of this information.