

Your TradingView Chart is Not a Trading System
Stop letting The Emotional-Technical Loop break your execution.
TradingView makes it easy to find an entry. But what happens after the signal—manual position sizing, spread adjustments, and emotional second-guessing—is where accounts bleed out. Meet QuantView, our Trading System Operations Center: the framework that turns raw chart logic into an objective, risk-managed operating system.
The Problem Is Not Your Strategy. It’s The Loop.

The Emotional-Technical Loop Most traders don’t lose because they lack a good indicator. They lose because they are trapped in a broken cycle:
- The Technical Trap: Piecemeal tools force you to manually calculate lot sizes, eyeball risk, bridge disconnected charts, and hope your broker execution matches your backtest.
- The Emotional Toll: When volatility shifts or drawdowns hit, manual handoffs trigger hesitation, revenge trading, and impulsive overrides.
You cannot solve an operational architecture problem with pure willpower. You need a system that decouples market logic from execution stress.
QuantView is your Trading System Operations Center

1. Strategy Logic (The Engine): The Modular Signal Core
- Decoupled Market Intelligence: The engine operates independently of specific entry mathematics, meaning any modular technical setup—whether built on Smart Money Concepts (SMC), volatility-adjusted SuperTrends, moving-average crossovers, or momentum convergence—can drive the core architecture.
- Multi-Model Versatility: Signals are translated into standardized triggers, allowing traders to swap underlying market concepts (such as transitioning from an Order Block/FVG model to an EMA cross) without rewriting execution rules or risk parameters.
- Structural and Bar-State Anchoring: Enforces strict confirmation checks using closed-bar data (
barstate.isconfirmed) to eliminate visual repainting, ensuring that historical test triggers match real-time chart behavior identically.
2. Test & Validate (The Sandbox): Multi-Environment Verification
- Instant Historical Quick-Tests: Instantly processes all available historical bar data upon script loading to generate deep simulation metrics and performance baselines without calculation lag.
- Replay Mode Verification: Operates seamlessly inside TradingView’s Replay Mode, treating simulated historical candles as live data streams to validate execution timing, stop handling, and order logic minute-by-minute.
- Forward Logs & Audit Trails: Generates hardcopy records and live performance logs during forward-testing phases to evaluate real-time system stability before committing live capital.
3. Configure & Optimize (The Dashboard): Rapid Configuration Comparison
- Cross-Timeframe Parameter Mapping: Facilitates rapid “what-if” prototyping by allowing traders to instantly compare different configuration sets, indicator lengths, and multipliers across multiple timeframes from a single interface.
- Emulated Time-Perioding: Decouples chart visualization from calculation time by running higher-timeframe logic (e.g., a 15-minute structure) directly on granular lower-timeframe charts (e.g., 1-minute) via rolling analytical windows.
- Dynamic Regime Adaptation: Automatically shifts operational profiles based on real-time market volatility states (ranging, trending, or high-volatility regimes) to adjust risk percentages, stop multipliers, and profit targets dynamically.
4. Define Risk (The Shield): Institutional Capital Protection
- Dynamic Position Sizing: Automatically computes exact lot and unit sizes based on live account balance, chosen risk percentage, and precise stop-loss distances in ticks: $$\text{Position Size} = \frac{\text{Account Balance} \times \text{Risk \%}}{\text{Stop Loss Distance (Ticks)} \times \text{Tick Value}}$$
- Spread-Friction Compensation: Factors live broker spread and slippage directly into entry and stop calculations, adjusting take-profit and stop-loss boundaries to protect the net reward-to-risk ratio against hidden transaction costs.
- Drawdown Circuit Breakers: Enforces strict structural safeguards, including daily drawdown limits, peak equity tracking, and a mandatory 24-hour consecutive loss lockout mode to prevent emotional over-trading during adverse market phases.
5. Operate & Observe (The Glass-Box Telemetry): Real-Time Order Tracking
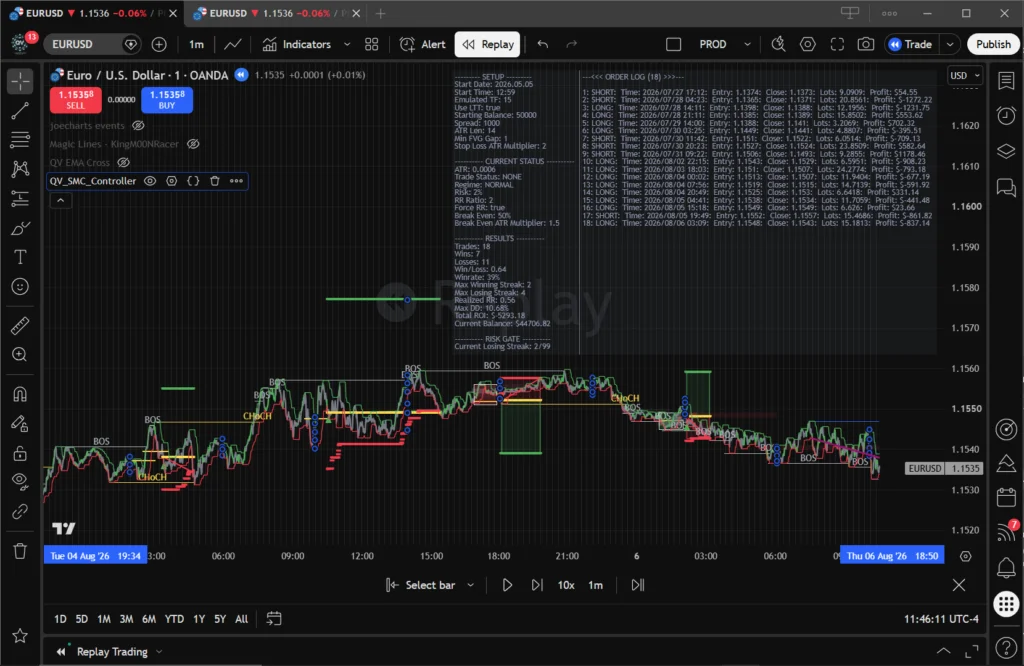
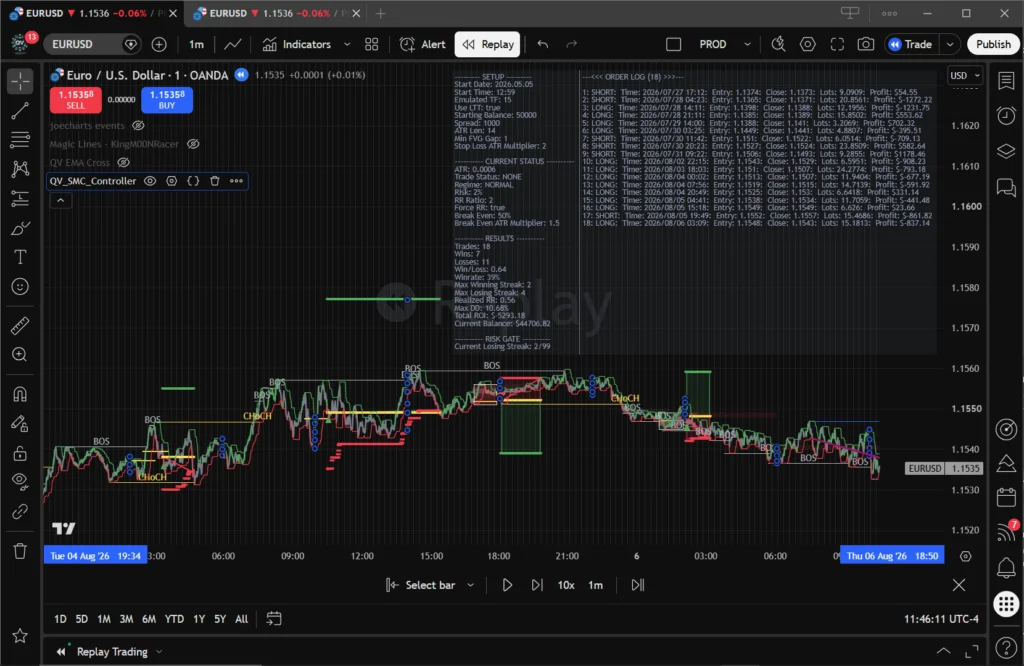
- Integrated Heads-Up Display (HUD): Displays a real-time on-chart performance panel updating metrics on every tick, including win rate, profit factor, net R-multiple return, max drawdown, and active trade state.
- Visual Order Connectors: Draws precise visual history lines connecting exact trade entry points to their exits, providing immediate clarity on whether a trade captured a trend or suffered in choppy consolidation.
- Comprehensive Audit Trails: Tracks every internal state change—such as stop adjustments, break-even activations, and higher-timeframe filter overrides—ensuring complete visibility into why every trade decision was made.
6. Execute Deliberately (The Gateway): Zero-Latency Broker Routing
- Order Integrity Validation: Continuously reconciles internal execution states with broker-reported records to ensure complete synchronization between chart logic, webhook transmission, and exchange execution.
- Standardized JSON Payloads: Converts validated trade plans into structured JSON strings containing instrument identifiers, exact volumes, calculated stop-losses, take-profits, and cryptographic alert tokens.
- Zero-Latency Webhook Routing: Dispatches webhooks instantly from TradingView alerts to local or cloud-hosted execution gateways (such as a Python/FastAPI server) for direct broker order fulfillment.
Blog Posts


$49.00$25/ monthly (Billed Annually)
Get Your All Inclusive Membership Now
A single license grants you access to all of our scripts- Our Flagship QV with SMC – Coming September 2026
- QV with MA Crossover – Coming September 2026 FREE!!
- QV with SuperTrend – Coming Soon
- QV with RSI Convergence – Coming Soon
- QV with MACD – Coming Soon
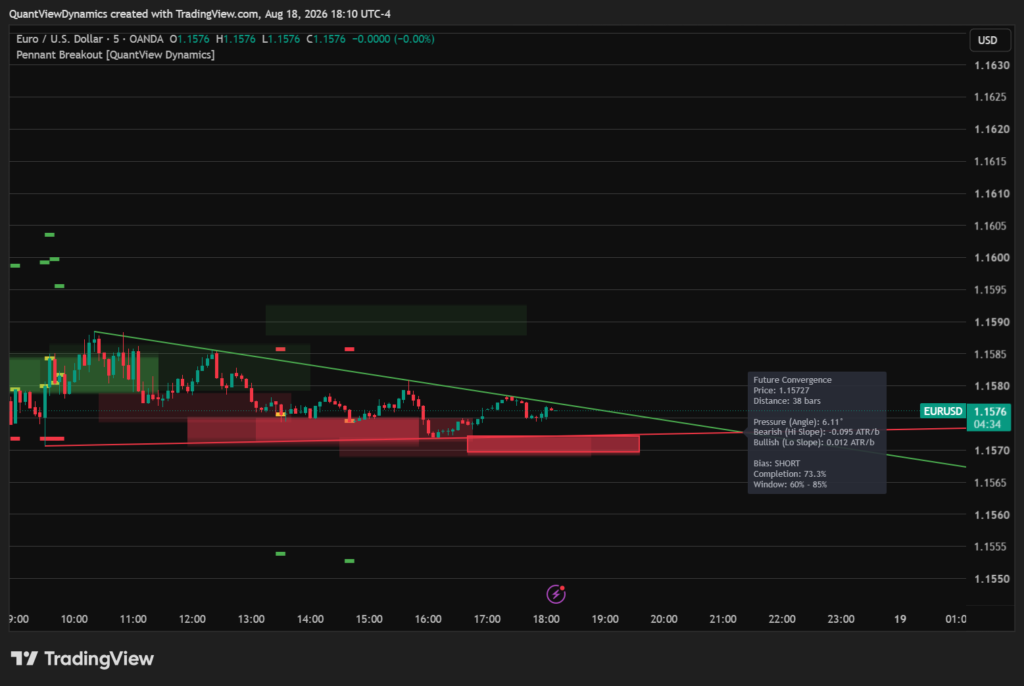
- QV with Pennant Breakout – Coming Soon
- Annual Updates
- Online Support