The Leader MACD [QuantView Dynamics] indicator is an institutional-grade momentum and trend-tracking system engineered to solve the lag inherent in standard MACD calculations. By computing a zero-lag Leader Moving Average layer, projecting oscillator curves directly onto chart price action, and supporting four distinct trigger mechanisms, the system gives traders early access to momentum shifts while protecting against false breakouts and choppy consolidation.
PURPOSE
Traditional MACD indicators suffer from a well-known vulnerability: significant signal lag caused by dual smoothing steps. By the time a standard MACD line crosses its signal line, a substantial portion of the trend’s initial momentum has already occurred, forcing traders into late entries with unfavorable risk-to-reward ratios.
The Leader MACD resolves this structural delay by integrating an adaptive error-correction pipeline:
- Lag Reduction via Leader MA: Calculates the difference between the source price and its baseline moving average, smooths that difference, and feeds it back into the average. This creates a leading curve that reacts to directional acceleration bars ahead of conventional averages.
- Projected Price-Action Overlay: Translates momentum math from a disconnected sub-panel into direct chart curves anchored to
OHLC/4, enabling visual momentum tracking alongside raw candle structure. - Multi-Condition Execution: Allows traders to independently toggle four distinct signal catalysts—Leader crossovers, Signal line crossovers, swing pivot momentum divergences, and Zero-line crosses.
USAGE
The indicator operates as an all-in-one momentum cockpit directly on the main price chart:
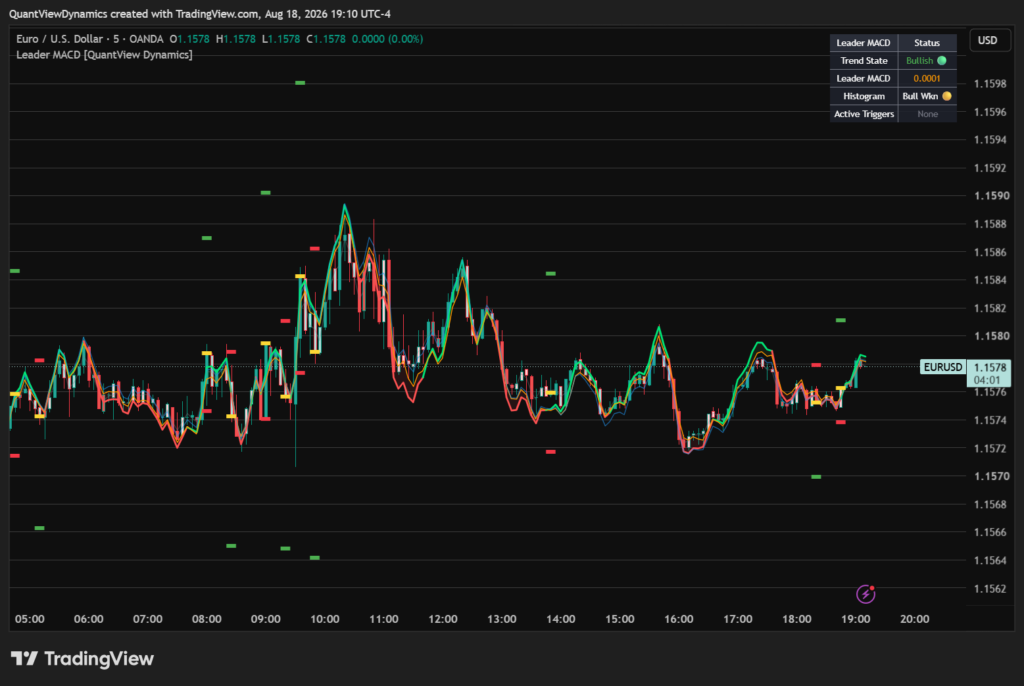
- Visual Momentum Curves: When
Show Projected Momentum Curvesis active, the system plots the Projected Leader MACD (green/red dynamic line), Projected Signal Line (orange), and Projected Standard MACD (blue) anchored to theOHLC/4baseline. - Macro Trend Cloud: Enabling
Show Macro Trend Cloudrenders the Leader Fast and Slow moving averages with an adaptive green/red background fill to establish macro trend direction at a glance. - Momentum Bar Coloring: Candles are color-coded in real time across four distinct momentum states: Dark Green (Bullish Expansion), Light Green (Bullish Weakening), Dark Red (Bearish Expansion), and Light Red (Bearish Weakening).
- Signal Identification & Target Placement: When an enabled condition fires on a confirmed bar close, the script plots Entry (
-in yellow), Stop Loss (-in red), and Take Profit (-in green) markers. Stop distances scale via ATR, while profit targets lock to the user-defined Reward:Risk ratio. - Diagnostic HUD: The on-chart dashboard displays the active Trend State, live Leader MACD value, Histogram momentum status, and all currently firing trigger conditions (
C1,C2,C3,C4).
DETAILS
- 10 Selectable Moving Average Foundations: Choose from EMA, SMA, WMA, RMA, VWMA, Hull MA (HMA), Double EMA (DEMA), Triple EMA (TEMA), Arnaud Legoux (ALMA), and Zero-Lag EMA (ZLEMA) to drive the underlying MACD logic.
- Flexible Signal Routing: Toggle whether the Signal Line and Histogram calculate from the fast Leader MACD line or from the classic Standard MACD baseline.
- Four Independent Signal Triggers:
Condition 1: Leader MACD vs. Standard MACD crossover/crossunder (Fast early momentum shift).Condition 2: Leader MACD vs. Signal Line crossover/crossunder (Traditional signal line trigger).Condition 3: Structural Momentum Divergence (Detects price swing pivot divergence against the Leader MACD curve).Condition 4: Leader Zero-Line Cross (Momentum polarity shift).
- No-Repaint Architecture: Enforces confirmed candle close evaluation (
confirmedOnly), eliminating intra-bar signal repainting while preserving real-time curve plotting. - Adaptive AI/ML Self-Tuning Framework (Member version only): When compiled with the master
ENABLE_AIflag enabled, the system unlocks an internal Hill-Climbing parameter optimizer and a k-Nearest Neighbors (k-NN) Euclidean distance classifier to tune lookback lengths and validate trade vectors against historical winning setups.
SETTINGS
MACD Settings
Moving Average Type: Select the foundational MA smoothing algorithm (SMA, EMA, WMA, RMA, VWMA, HMA, DEMA, TEMA, ALMA, ZLEMA).Source: Price series source input (default:close).Calculate Signal Line from Leader MACD?: Determines whether the Signal Line and Histogram derive from the Leader MACD or Standard MACD.Fast Length/Slow Length/Signal Length: Period lengths for the MACD oscillator calculations (standard defaults:12,26,9).ALMA Offset/ALMA Sigma: Controls Gaussian distribution parameters when ALMA smoothing is selected.
Signal Condition Toggles
1. Leader / Standard MACD Crossover: Toggles early momentum cross signals.2. Leader / Signal Line Crossover: Toggles signal line trigger signals.3. Leader Momentum Divergence: Toggles structural pivot divergence sensing.4. Leader Zero-Line Cross: Toggles baseline polarity crossover signals.Require Confirmed Bar Close (No Repaint): Restricts signal generation strictly to confirmed bar closes.
Divergence Settings
Divergence Pivot Left/Divergence Pivot Right: Lookback and lookforward bar counts for detecting structural swing highs and lows on the Leader MACD line.
Risk & Stops
ATR Multiplier for Stop Loss: Multiplier applied to the 14-period ATR to determine initial stop-loss placement from entry.Reward:Risk Ratio: Multiplier applied to the stop distance to set dynamic take-profit targets.
Overlay Display Settings
Show Macro Trend Cloud (MAs): Toggles shaded ribbon display between the Leader Fast and Slow MAs.Show Projected Momentum Curves: Toggles on-chart projected curves anchored toOHLC/4.Show Momentum Bar Coloring: Color-codes chart candles based on histogram acceleration and deceleration.Show On-Chart Dashboard (HUD)/HUD Position: Toggles and positions the real-time diagnostic table (Top Right,Bottom Right,Top Left,Bottom Left).Show Signal Markers: Toggles Entry, Stop Loss, and Take Profit marker plots on the chart.
Self-Tuning & ML Settings (Available when ENABLE_AI is Active, member version only)
Enable Self-Tuning Optimization: Toggles autonomous Hill-Climber parameter adaptation.Fast / Slow / Signal Length Ranges & Steps: Bounded parameter ranges for dynamic lookback tuning.Enable k-NN Distance Filter: Activates the machine learning feature validation classifier.Historical Memory Size: Capacity for storing historical winning feature vectors (default:30).Max Euclidean Distance Threshold: Maximum vector distance allowed for trade signal confirmation (default:2.5).
SUMMARY
The QuantView Leader MACD indicator turns a classic oscillator into an overlay momentum tool. By pairing responsive Leader MA mathematics with chart projections, structural divergence detection, and risk-management targets, it equips traders to anticipate trend acceleration early while navigating market volatility with clarity and precision.