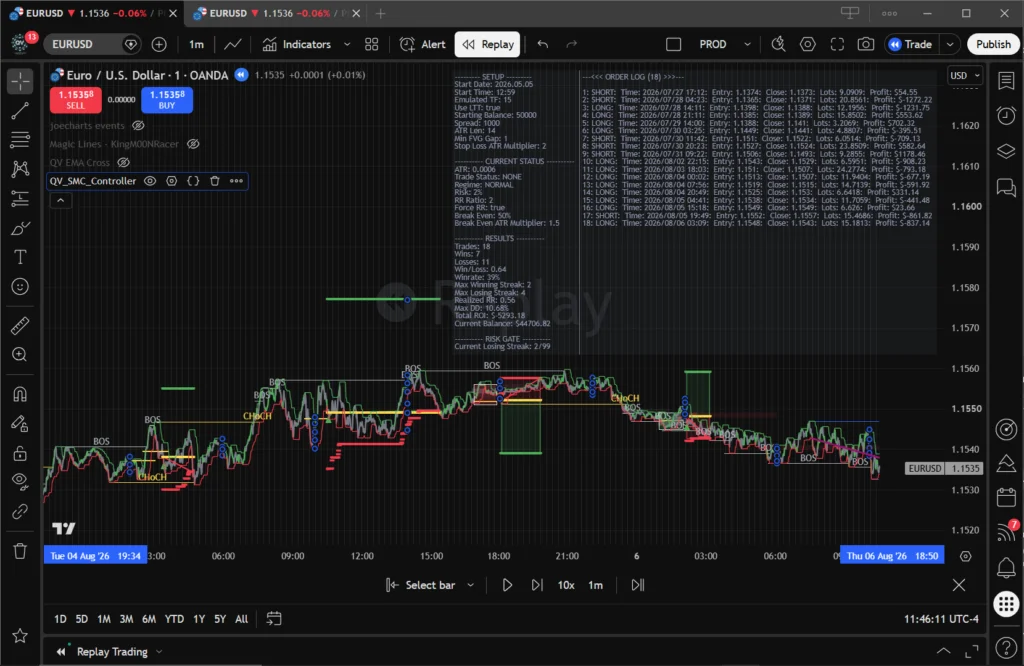
Breaking the Timeframe Dilemma: How Rolling Time Windows Eliminate Indicator Lag and Repainting
The Quick Answer: The classic tradeoff between noisy lower-timeframe chop and sluggish higher-timeframe lag is solved by decoupling Chart Time from Calculation Time. By using a rolling emulated time window, traders can watch a responsive base chart (like the 1-minute) while calculating higher-timeframe metrics (like the 15-minute) updated on every single closed bar. This provides 60 confirmed analytical evaluation points per hour instead of just 4—unlocking lightning-fast entry precision, smooth trend filtering, and 100% repaint-free signals.
The Great Multi-Timeframe Compromise
Every active market participant has wrestled with the fundamental compromise of technical analysis:
- The Low-Timeframe Trap (Excess Noise): Trade off a 1-minute or 3-minute chart, and you get nimble entries right at market inflection points. But the price you pay is brutal: relentless chop, false breakouts, and psychological exhaustion from chasing market noise.
- The High-Timeframe Trap (Unbearable Lag): Step up to a 1-hour or 4-hour chart to isolate the macroeconomic trend, and the chart becomes calm and clean. But by the time a major move begins at 10:05 and the candle finally closes at 11:00 to confirm your indicator signal, half the move is already in the rearview mirror. Your risk-to-reward ratio is ruined before you even place the order.
To bridge this gap, most retail traders reach for standard multi-timeframe (MTF) indicators. Unfortunately, that usually introduces an even deadlier problem: repainting.
When an MTF indicator references an open higher-timeframe bar, it prints tempting visual signals that vanish or shift the moment price moves before the hourly close. Backtests look flawless, but live accounts suffer catastrophic drawdowns.
The Breakthrough: Chart Time vs. Calculation Time
Solving the timeframe dilemma requires a fundamental shift in how your trading setup processes market data. Instead of being chained to the arbitrary clock boundaries of exchange candles, professional methodology separates what you view from how your analytical engine measures time.
The Power of the “Rolling Window”
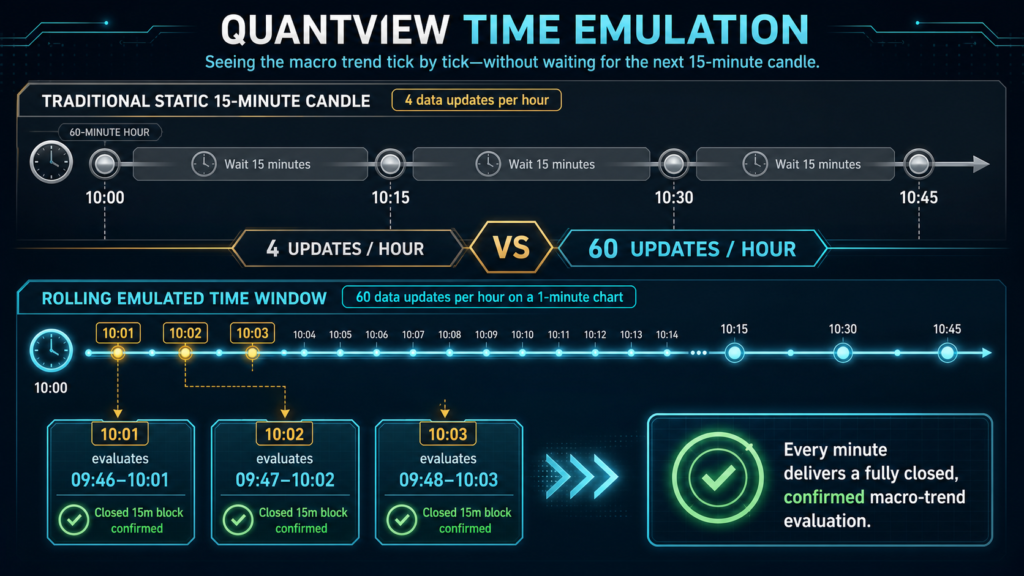
In a traditional setup, a 15-minute candle forces you to wait until :00, :15, :30, or :45 to receive a single completed data point.
Under a rolling time emulation model:
- You keep your visual workspace on a crisp, granular timeframe (e.g., 1-minute or 2-minute candles).
- The internal analytical engine constructs a rolling historical window matching your desired higher timeframe.
- At 10:05, the system analyzes the completed block from 09:50 to 10:05. At 10:06, it slides forward and evaluates the completed block from 09:51 to 10:06.
Instead of 4 static checks an hour, you receive 60 fully formed evaluation cycles every single hour. You detect macro momentum shifts the minute they become mathematically confirmed, entering trades with surgical precision without ever sacrificing high-timeframe stability.
Traditional MTF Indicators vs. Rolling Time Emulation
| Feature | Standard MTF Indicator | Rolling Time Emulation Engine |
|---|---|---|
| Signal Confirmation | Waits for fixed candle close (:00, :15, :30, :45). | Continuous rolling updates on every base bar close. |
| Evaluation Frequency | 4 checks per hour (on 15m timeframe). | 60 checks per hour (15m window on 1m chart). |
| Repainting Risk | High; signals shift or vanish on open candles. | Zero; every evaluated rolling window is fully closed and locked. |
| Execution Timing | Delayed entries chasing late candle closes. | Real-time entry timing with macro-level trend alignment. |
| Backtest Reliability | Highly distorted due to lookahead bias. | 100% deterministic; historical backtests match live execution. |
Eliminating the “Silent Killer”: The Zero-Repaint Guarantee
Why do standard MTF scripts fail so miserably in live execution?
When a standard indicator references a higher-timeframe bar that has not yet closed, it is evaluating a moving target. If EUR/USD spikes upward at 10:10, a buy arrow appears. If price pulls back sharply at 10:14, the arrow disappears. When you look at the historical chart later, you only see the trades that survived—giving a completely false illusion of profitability.
Rolling time emulation permanently eliminates this flaw. Because each rolling period is composed entirely of completed, closed sub-bars from your base chart, every data point evaluated by your trend filters is locked in history.
If a momentum condition or moving average cross is triggered, it is etched in stone. It will never move, vanish, or repaint.
To see how rolling analytical engines integrate into a complete systematic trading architecture, explore Part 1: Why Your Forex Trading Strategy Needs an Operating System and Part 2: The “Framework-First” Advantage.
The Practical Takeaways for Active Traders
To upgrade your execution quality across fast-moving markets:
- Stop Trading Off Open Candles: Never allow an entry trigger or risk filter to calculate off incomplete higher-timeframe bars. If the data isn’t closed, it isn’t real.
- Decouple Chart View from Analytical Math: Use granular base charts (1m to 5m) to time your exact entries and order placement, while letting a rolling analytical engine handle trend filtering.
- Capture Micro Agility with Macro Discipline: By evaluating completed rolling windows continuously, you capture structural market shifts dozens of minutes before traditional traders even see their candles close.
The Verdict
In trading, timing is everything—but waiting for arbitrary clock hands to complete a candle is an outdated relic of manual charting.
By leveraging rolling time emulation, you no longer have to choose between the chaotic whipsaws of a 1-minute chart and the agonizing lag of a higher-timeframe bar. You get the best of both worlds: macro-trend stability and micro-entry agility, with zero risk of repainting.
Join the Discussion
How do you currently balance trend filtering against entry lag in your trading? Have you ever fallen into the trap of a repainting multi-timeframe indicator during live market conditions?
Share your experiences, questions, and chart management routines in the comments below!